
Happy Monday, folks. We’re kicking off the week by highlighting some of the best Terra data dashboards from the past week.
We’ve got six Terra data dashboards to highlight this week. That includes submissions from MarneeSeaweed, @TheHargunSingh, @darksoulsfanlol, and @TZMCrypto.
Let’s dive in.
More liquidity pours into mAssets
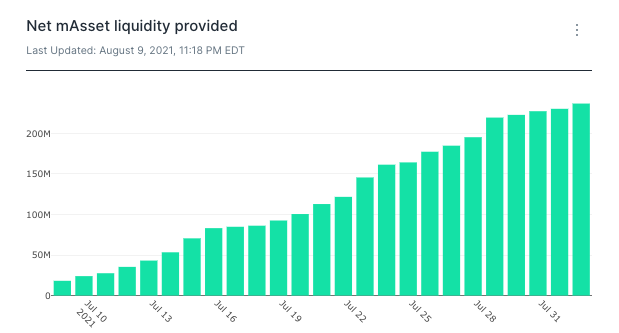
We’ll start with a look at the liquidity on Mirror from MarneeSeaweed. This submission looked to find out just how impactful the news that Uniswap would blacklist mAssets was to liquidity on the platform. To find out, MarneeSeaweed explored the number of transactions that involved the buying or selling of an mAsset, as well as the net liquidity provided to mAssets after July 23.
As we can see in the graphs below, the net liquidity of mAssets continued to rise following the new. What’s more, the number of transactions involving the purchase of an mAsset also increased. Based on these factors, MarneeSeaweed concluded that the Uniswap news had no tangible impact on users’ confidence in mAssets.
Q1 Stakers hold on through Q2
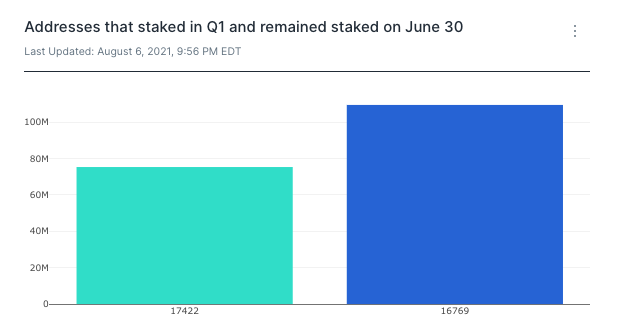
MarneeSeaweed is back again in our next submission, this time tackling staking on Terra. More specifically, this submission looked to examine whether users who staked LUNA in Q1 of this year remain staked through Q2.
The number of addresses that still remained staked in Q2 saw a drop of just 3.7% while the amount of staked LUNA increased by 45%. This indicates that a majority of people who staked in Q1 increased their stake in Q2.
New mAssets means increased trading on Mirror
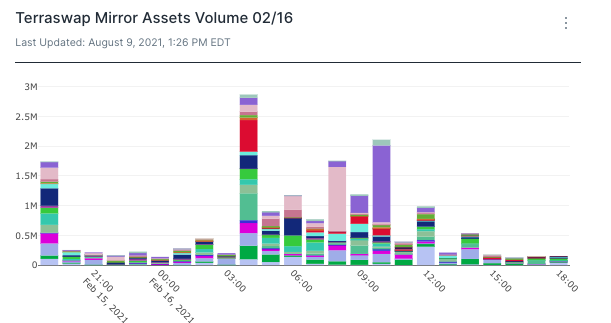
Our next submission, from @TheHargunSingh, also examines mAsset activity on Mirror. This time, the submission focuses on activity surrounding the minting of new mAssets, and whether these events stimulate trading as a whole on Mirror.
As we can see in the graph below, trading on Mirror spiked sharply following the debut of the Terraswap mAMC-UST pair. We can see the spike in the staked bars beginning at roughly 4 AM and extending through the morning. A similar pattern occurred following the debut of the Terrawap mCOIN-UST pair. This shows a pattern of increased trading following the debut of a new mAsset.
Terra fees depend on non-paying transactions
Our next submission examines fees on Terra and seeks to determine the relationship between fees and the number of transactions. In this case, our author, @darksoulsfanlol guessed there would be a positive relationship between the two. But, as we can see in the graph below, this wasn’t the case.
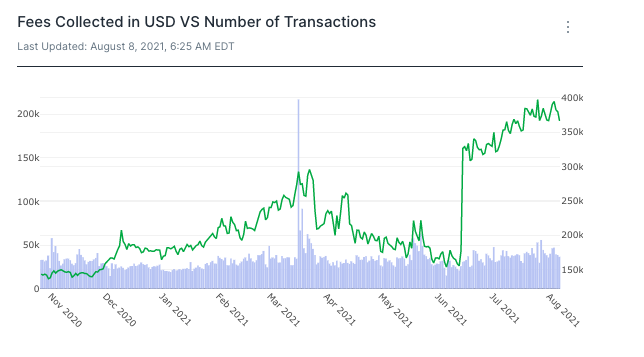
So what is responsible for fluctuations in fees on Terra? According to @darksoulsfanlol, it comes down to the number of non-paying transactions taking place on the platform.
Terra fees depend on non-paying transactions
Last but not least is a submission from @TZMCrypto. This submission examined LUNA delegation distribution and sought to find the spread of staked LUNA among all validators. To find the answer, @TZMCrypto started by examining the top 10 validators on the platform. From there, we’re able to see how the biggest validators are responsible for holding more than 134 million LUNA, as is displayed in the chart below. This includes the amounts they self-delegate.

So how volatile can this leaderboard get? As the submission shows, the existing validator system is fairly healthy and decentralized. Roughly 87 percent of modes share roughly 95% of staked LUNA. A lower percentage could signal increased centralization.
Do more with Terra data 🔍
That does it for this week. Thanks to everyone who submitted such great Terra data dashboards! Want to get more involved with the Flipside community and see your own submissions on our blog? Join us on Discord to get started.